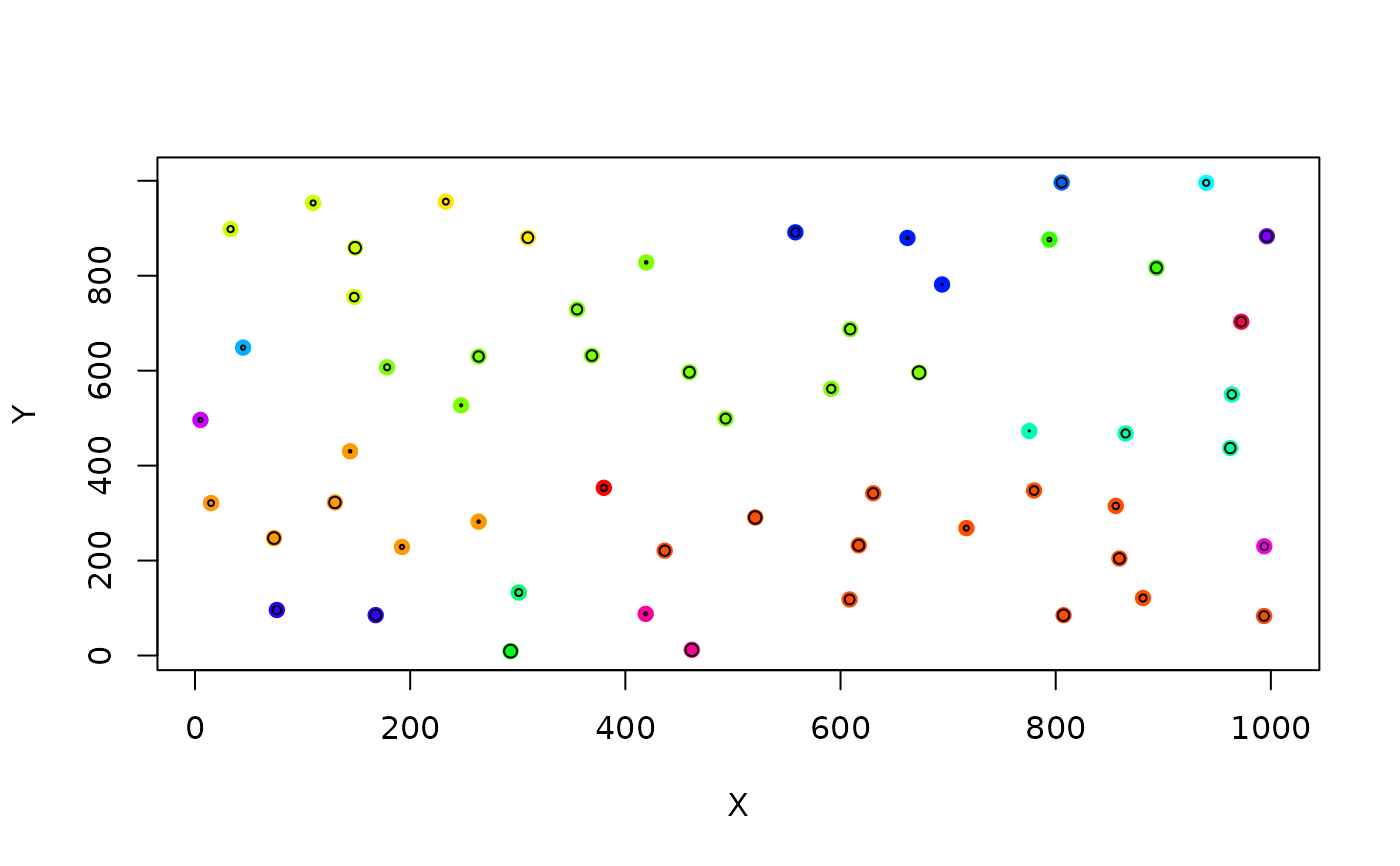
Plot one landscape of the list created by span.graph
plotL.graph.RdPlots a given landscape of a landscape sequence from span.graph.
Arguments
- rl
Object of class 'landscape'.
- rlist
List returned by
span.graph.- nr
index of the landscape to display graphically.
- species
TRUE/FALSE, TRUE if 'rl' is of class 'metapopulation' or 'FALSE' if rl is of class 'landscape'.
- links
TRUE/FALSE, show links between connected patches.
- ...
Other arguments.