Graphical display of the landscape
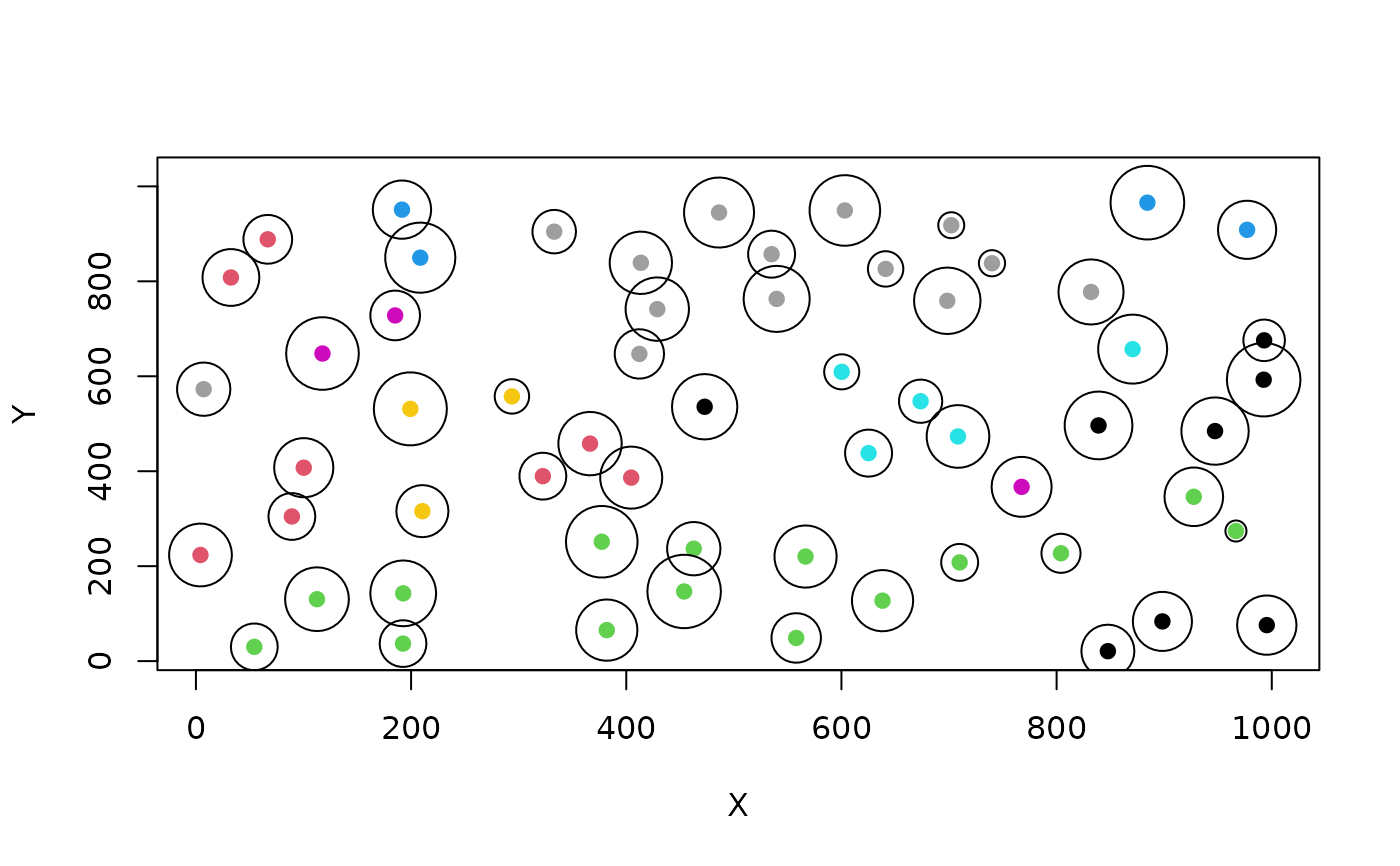
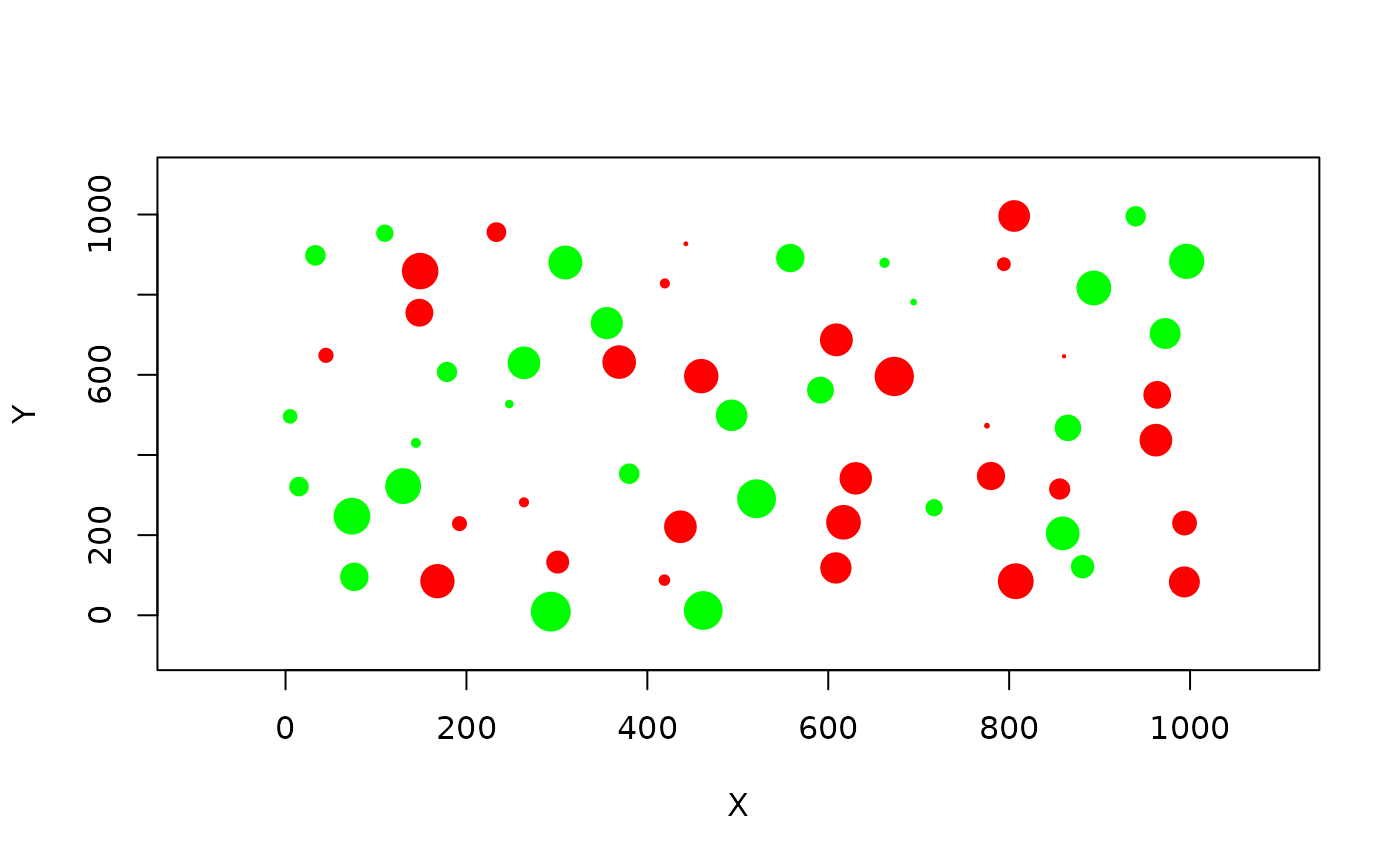
plot_graph.RdPlots the landscape graph, with or without the species occupation (respectively lists returned by species.graph or rland.graph) and with or without the links between patches.
plot_graph.RdPlots the landscape graph, with or without the species occupation (respectively lists returned by species.graph or rland.graph) and with or without the links between patches.